Vaibhav Attre.boot

retro-futurist workstation init

[ 0.000] POST: workstation bus scan complete
[ 0.013] memctl: 64 GiB addressable, ECC nominal
[ 0.029] sched: run queue initialized
[ 0.041] fs: mounting /home/vaibhav
[ 0.068] net: link up on loopback and uplink0
[ 0.091] ui: terminal compositor ready
[ 0.112] session: entering interactive workspace
Loading command bus, filesystem tree, and process monitor.
Vaibhav Attre.ws
/projects/telemetry-platform
shell bus
vaibhav@ws:/projects/telemetry-platform$ session
interactive workstation online
type `help` or press `/` to focus the shell
tab completes top match
/projects/telemetry-platform

Telemetry Platform

AWS-backed QEMU experiment runner with artifact pipelines, statistical regression analysis, and LLM-assisted triage for OS workloads.

Telemetry platform dashboard for workload artifacts and regression analysis
infrastructure

Telemetry Platform

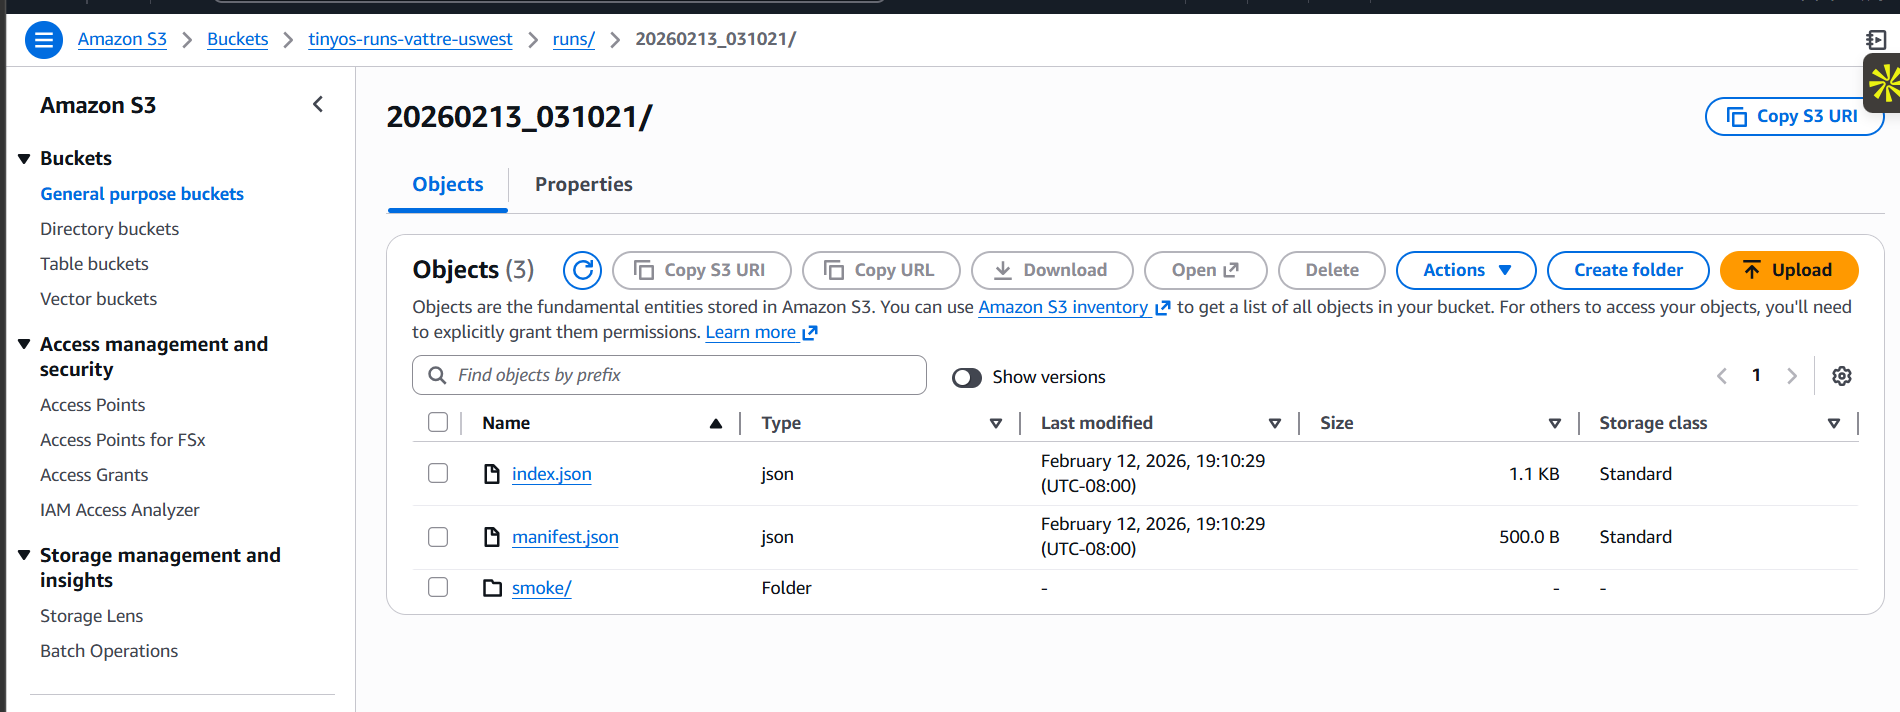
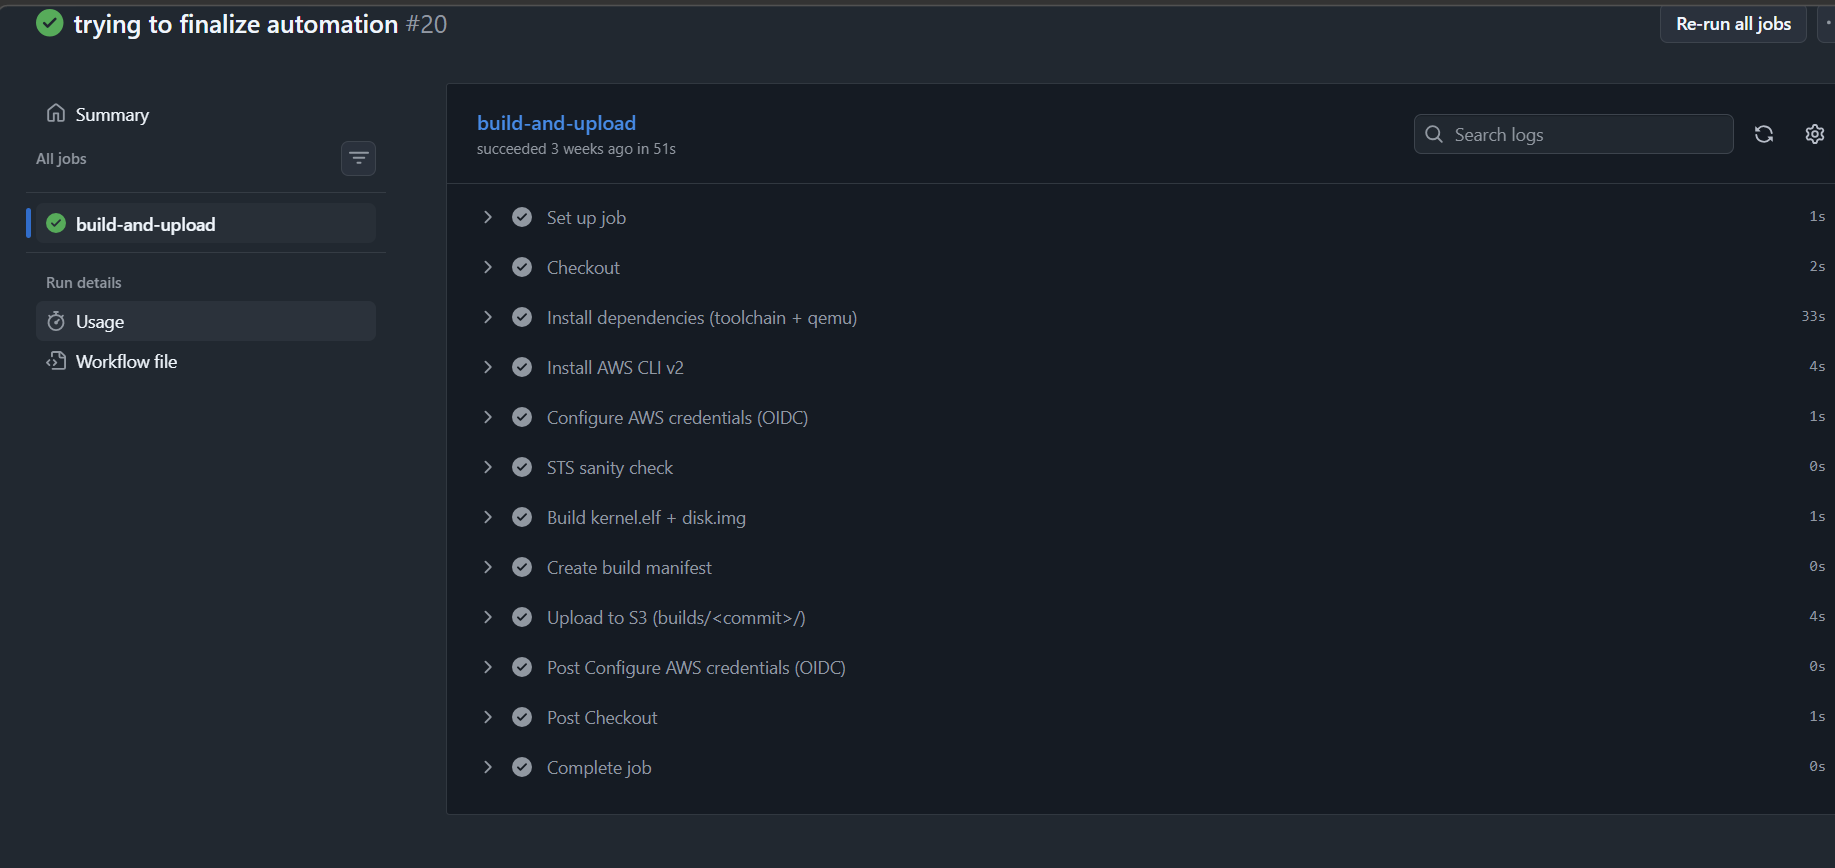
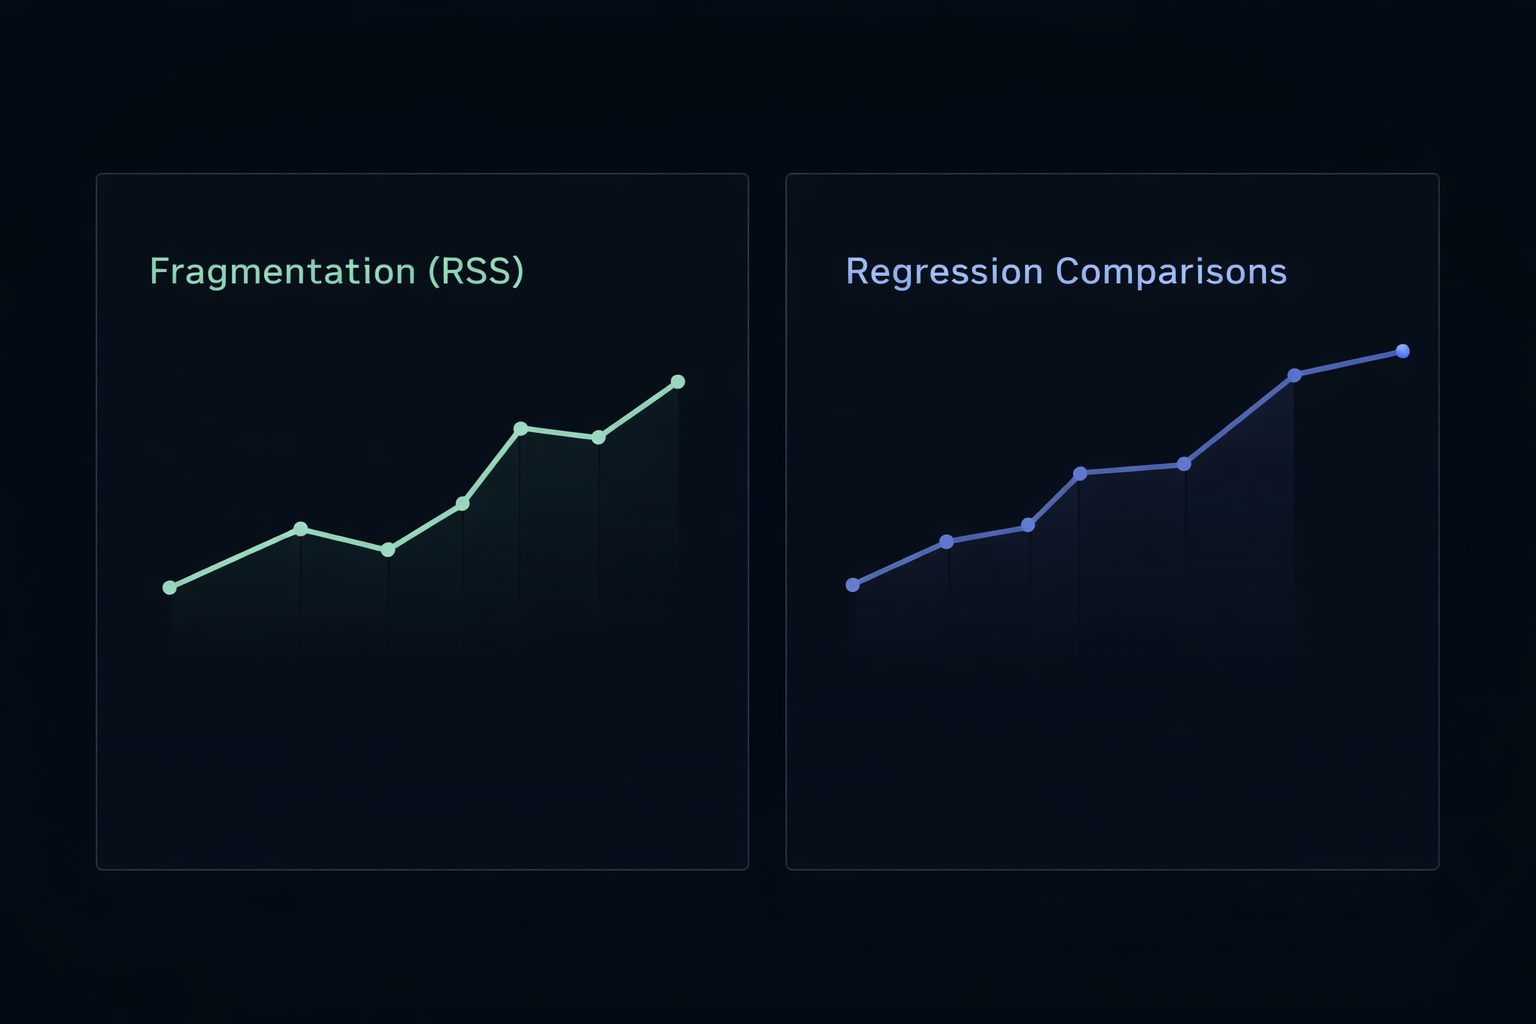
Telemetry Platform is an experiment and observability system for TinyOS and other low-level workloads. Instead of treating kernel testing as one-off local runs, it turns each QEMU execution into a structured experiment with versioned artifacts, metadata, and comparable metrics. The platform dispatches workloads through cloud-backed runners, stores outputs such as kernel logs and metrics, applies statistical analysis to detect regressions and variation across runs, and uses LLM-assisted summarization and triage to help interpret failures, anomalies, and performance shifts.

date: 2026 - Presentstatus: active
overview

OS experimentation is often ad hoc: local runs are hard to reproduce, logs are hard to compare, and noisy performance data makes regressions difficult to trust. This project turns systems testing into a structured telemetry and analysis pipeline.

implementation
Automated workload execution under QEMU and exported logs, metadata, and metrics into structured artifacts for each run.
Built a queued cloud runner backed by AWS services so experiments could be dispatched, executed, and collected consistently.
Added statistical analysis over repeated runs to measure variance, compare distributions, and detect meaningful regressions.
Integrated LLM-based log and artifact analysis to summarize outcomes, surface likely root causes, and assist with triage.
Connected the platform to CI so regression-oriented workloads run alongside code changes rather than as manual checks.
challenges
Experiment outputs must stay structured enough for comparison, not just storage.
Performance data is noisy, so the platform has to distinguish genuine regressions from ordinary variance.
Cloud orchestration, artifact indexing, and traceability are just as important as the QEMU runner itself.
LLM-assisted analysis has to be useful for debugging without replacing the raw evidence engineers need to inspect.
The workload set needs to be representative enough to catch meaningful issues without turning into unmaintainable noise.
outcomes
Built a bridge between low-level OS experimentation and production-style telemetry discipline.
The platform makes regression detection, artifact review, and failure triage far more systematic.
Statistical analysis improves confidence in performance conclusions across repeated runs.
LLM-assisted summaries make logs and experiment outputs faster to interpret during debugging and iteration.
architecture notes
The platform uses queued jobs, cloud workers, containerized QEMU execution, and durable artifact storage for repeatable systems experiments.
Metadata indexed in DynamoDB makes each run queryable by workload, build, commit, and experiment configuration.
Statistical aggregation across repeated runs helps identify latency shifts, instability, and performance regressions with more confidence.
LLM-based analysis layers on top of raw logs and metrics to summarize failures, compare runs, and assist with debugging.
GitHub Actions integrates smoke tests and regression-oriented workloads directly into the development loop.
stack
PythonQEMUDockerAWSGitHub ActionsLLMsStatistical Analysis
highlights
Processed 200+ experiment runs across 10+ OS workloads.
Stored structured artifacts including kernel logs, run metadata, metrics, and regression comparison outputs.
Connected local workload automation to AWS SQS, EC2, S3, DynamoDB, and CI-based execution flows.
Added LLM-assisted summarization to interpret logs, flag anomalies, and explain likely regression causes.
Used statistical analysis across repeated runs to separate real regressions from noise and runtime variance.
metrics
runs
200+
workloads
10+
artifact types
4+
media
Telemetry platform S3 bucket view
Structured run outputs with metrics, regression diffs, and summaries.
Telemetry platform GitHub Actions view
CI integration with smoke tests and regression workloads running alongside code changes.